

SmartOdds lets you manually adjust the width of the Fluctuations column, allowing you to customise the odds comparison table to suit the way you analyse markets.
Whether you want more room to compare bookmaker prices or a larger graph to study market movements, you can resize the column in seconds.
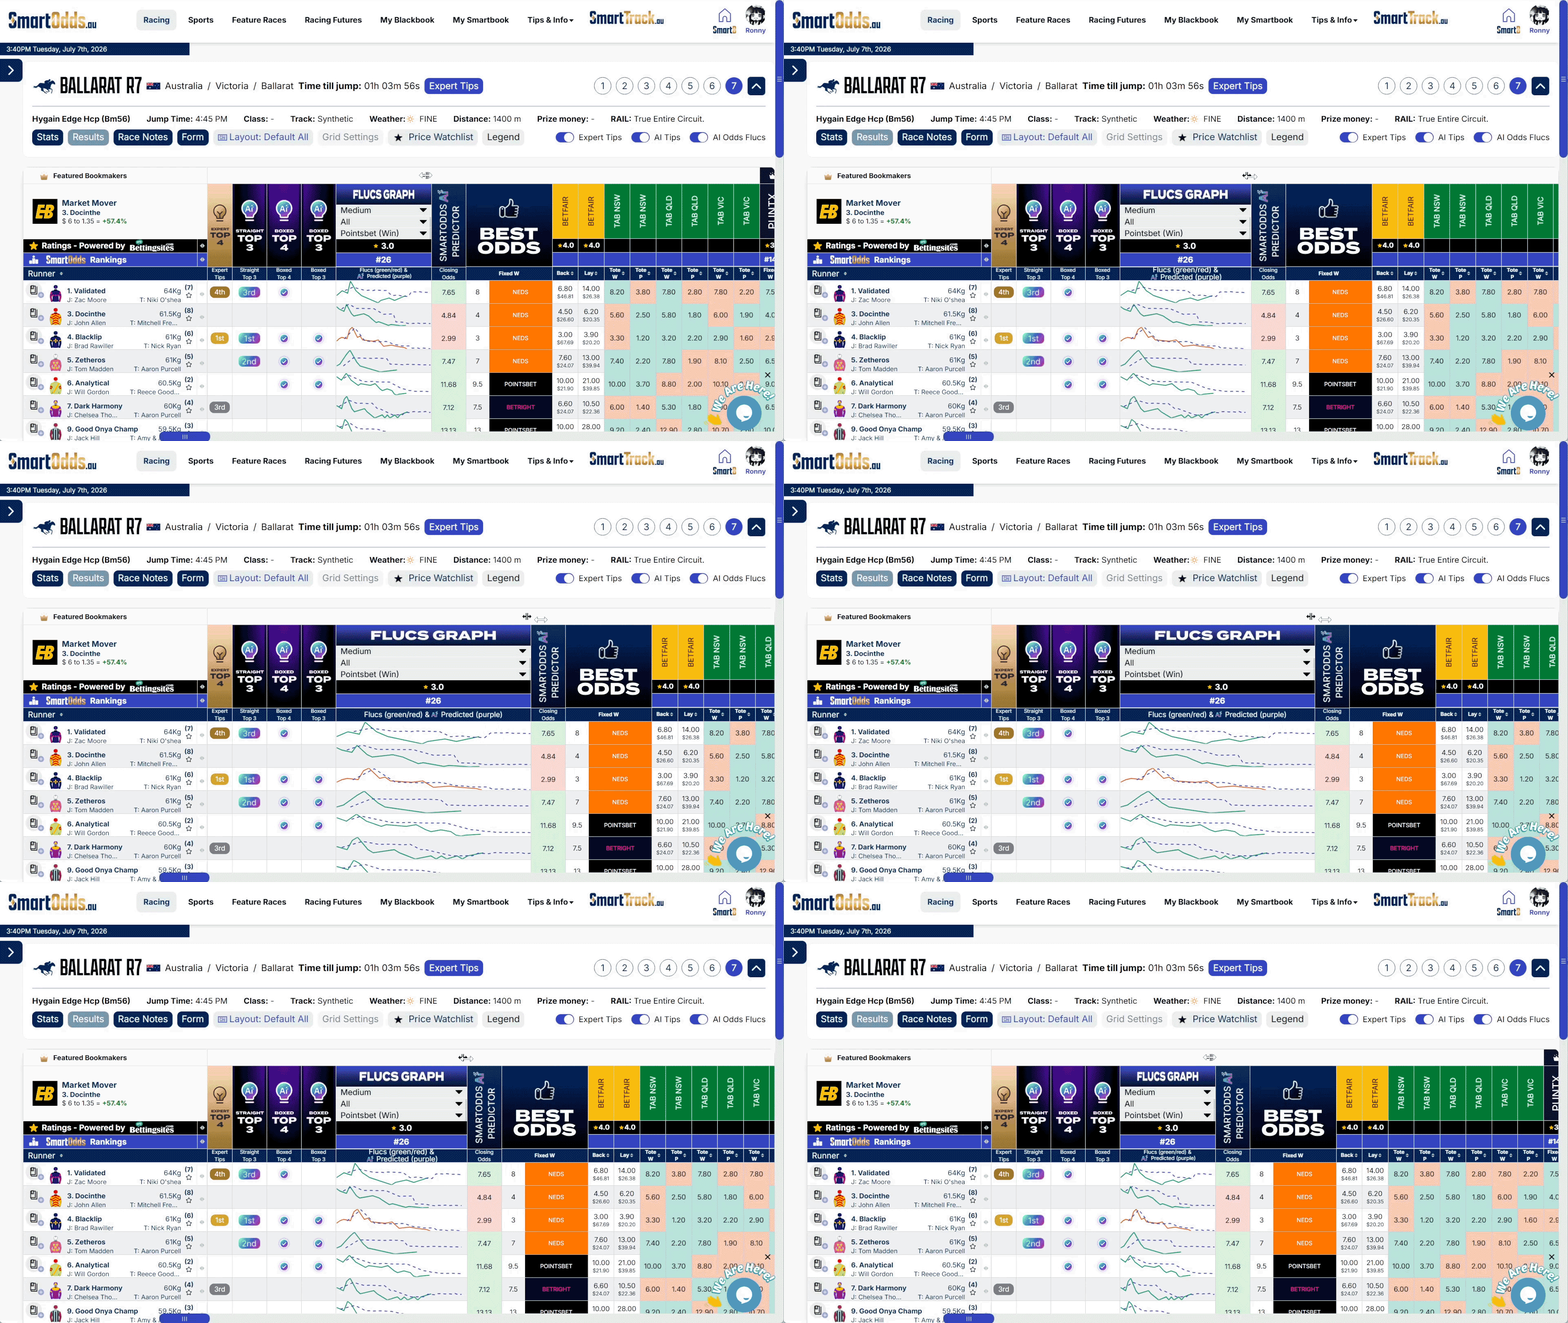
How to resize the fluctuations graph
- Open any race in the Odds Comparison table
- Hover over the right edge of the Fluctuations column
- When the resize cursor appears, click and drag:
- Left to make the graph narrower
- Right to make the graph wider
- Release the mouse when you’ve reached your preferred width
Why resize the fluctuations graph?
The odds comparison table can contain a large amount of information across the screen. Resizing the Fluctuations column allows you to prioritise what’s most important for the way you bet.
Make the graph narrower
- Display more bookmaker columns without horizontal scrolling
- Compare more prices at once
- Ideal when your focus is finding the best available odds
Make the graph wider
- View price movements in greater detail
- Better visualise markets with frequent price updates
- Identify firming, drifting and volatility more easily
Adjusting the Fluctuations column gives you greater control over your workspace, allowing you to switch between price comparison and market analysis whenever you need.