SmartOdds allows you to sort bookmaker columns by market percentage, helping you quickly identify which markets offer better value. This feature is available when using a custom layout.
Step 1: Open grid settings
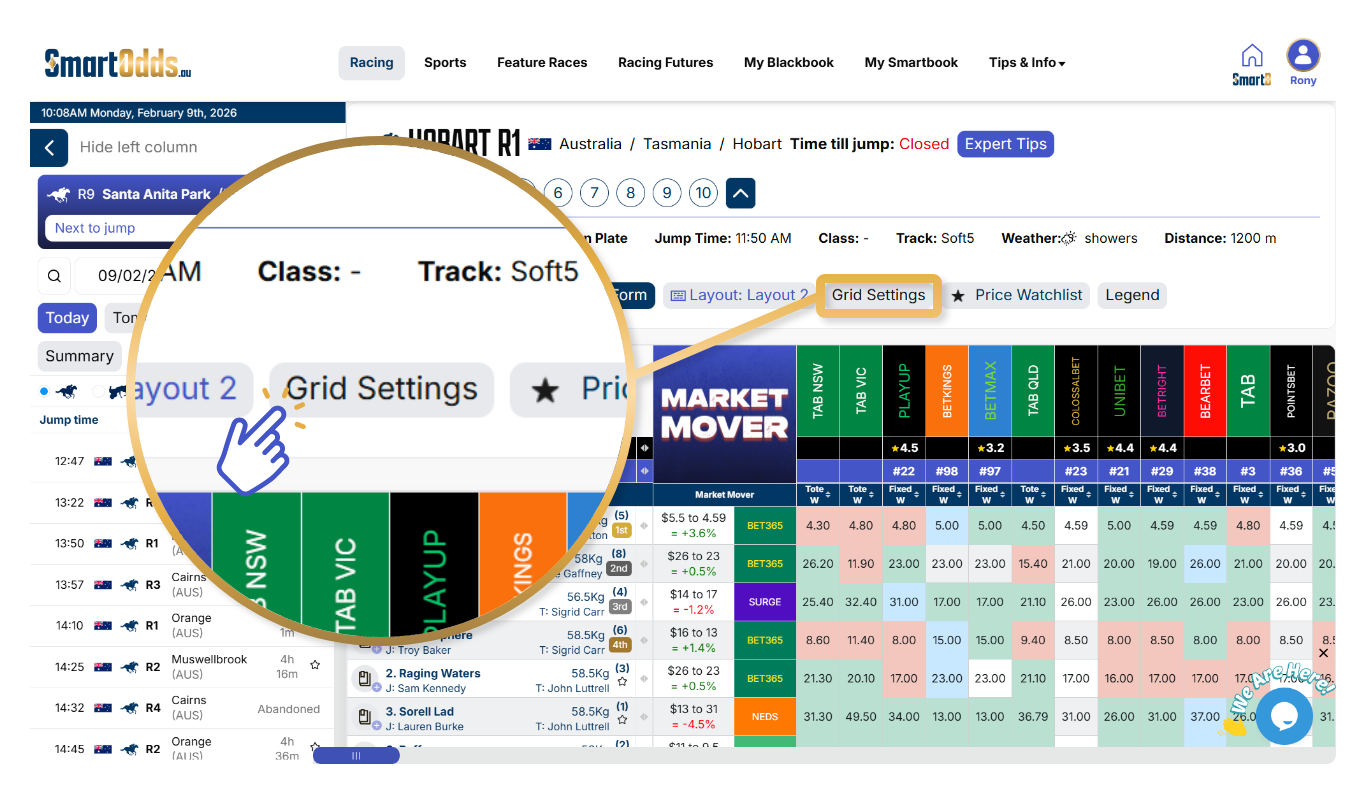
- Select a custom layout
- In the race navigation settings, click Grid Settings
- The grid settings overlay will open
Step 2: Enable sorting by market percentage
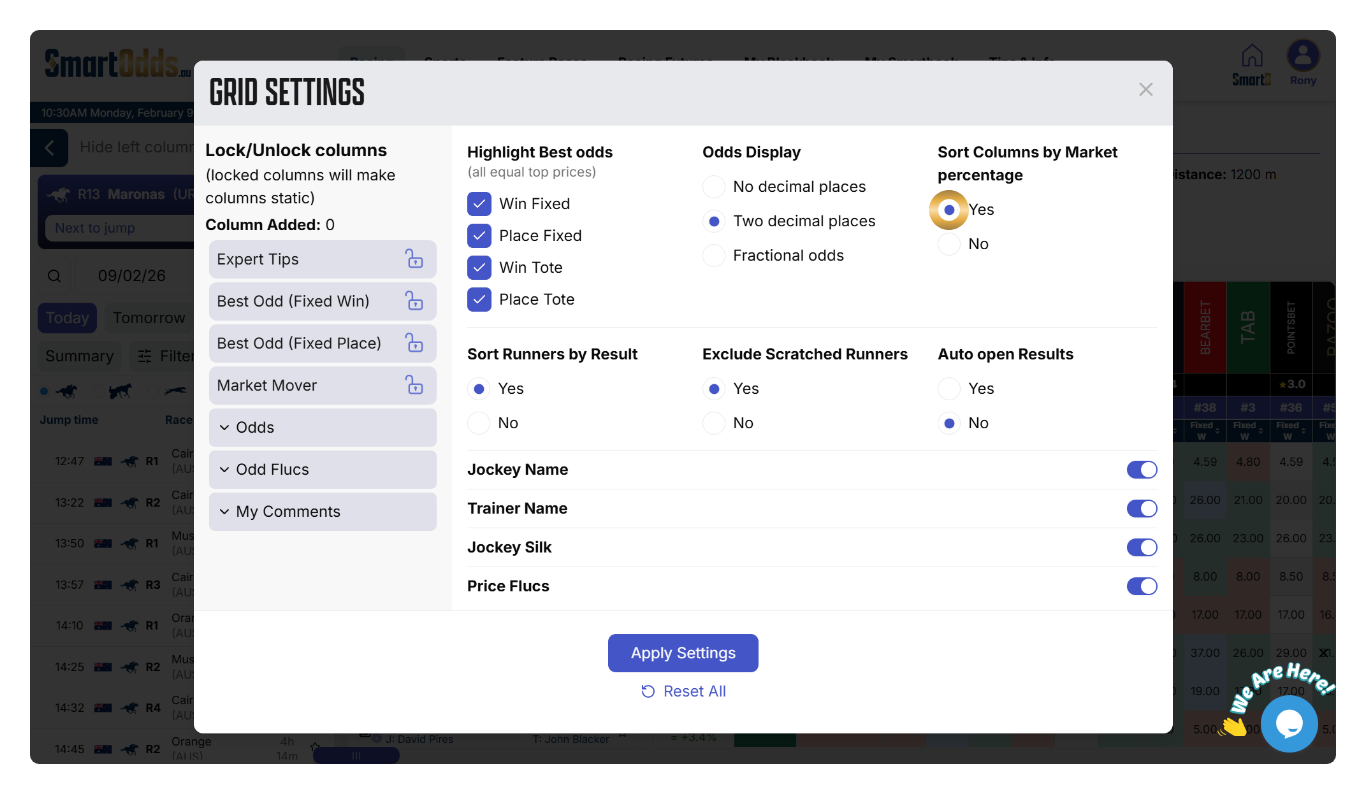
- Find Sort columns by market percentage
- Select Yes
- Click Apply Settings
Once enabled, bookmaker columns in the odds comparison table will be sorted by market percentage, making it easier to compare value across bookmakers at a glance.
Understanding market percentages and SmartOdds
Market percentage is often mentioned by racing commentators when discussing why odds appear short or why runners drift in early markets. It represents the total implied probability of all runners in a race and reflects the bookmaker’s built-in margin.
Market percentage is calculated by converting each runner’s odds into a percentage (100 divided by the odds) and adding them together. A higher market percentage means a greater bookmaker advantage, making the market harder to beat long term.
Using a real example from Gold Coast Race 5 on 22 November, early fixed odds markets showed bookmaker market percentages of 124.4% and 117.4%. At these levels, backing every runner would require staking more than $100 to win $100, highlighting how unfavourable high-percentage markets are for punters.
However, because different bookmakers priced runners differently, selecting the best available price for each runner across bookmakers resulted in a combined market percentage of 97.7%. This meant it was theoretically possible to back every runner and return a profit. This situation is known as arbitrage.
The example demonstrates how comparing odds across bookmakers can significantly improve outcomes and, in some cases, reduce the overall market percentage below 100%.